


Volatility & Gamma Report - Issue #5
An Equity & Volatility Macro View

[Note: This post is being added on Substack after originally being posted on Revue (which has discontinued their hosting operations).]
During the May 4 Fed Day, the FOMC announced a 50bps increase to the reserve rate.
A purely technical reaction drove stocks higher on Wednesday, as is common with nearly highly-anticipated market event, including FOMC days. Volatility is built up in advance of the event and sells off afterwards, which also causes a rise in equities as Market Markets adjust their books.
However, the equity rally and falling volatility are short-term market adjustments that do not result in sustainable rallies. Investors are merely taking an opportunity to reduce their long exposure in a structural bear market.
The Equity Bear Trend Began In 2021
In January we highlighted the dramatic shift in market gamma that most recently peaked in November 2021 when the FOMC dropped the word “transitory” from their inflation assessment, signaling pending rate hikes as an effort to control inflation.
In our tweet on Jan 5, 2022, we said
Clear as day that ARKK continues to be out of favor since early Nov based on gamma and skew.
Top holdings no longer carrying the negative gamma that was driving prices higher in 2020 & early 2021.
$TSLA $TDOC $COIN $U $ROKU $SHOP $ZM $PATH $SQ $PLTR
https://t.co/Vs20uileM8 https://t.co/u8Atc1UvH0
8:26 AM - 5 Jan 2022
The macro forecast has remained consistent since November with no change to the bear trend. Namely:
⭐ There are inflationary pressures, largely caused by a range of supply issues and increasing demand / hoarding of raw materials / national protectionism.
⭐ There is a reduction of liquidity from the Federal Reserve in the form of Quantitative Tightening (QT) as they decrease their asset levels, in addition to their rate increases.
We Are 14+ Months into a Bear Market
The more sophisticated institutional investors have correctly forecasted this move, with those equities most impacted by rising rates (specifically high-growth speculative stocks plays) peaking way back in Q1 2021.
Pros Use Option Flow Data
Pros have been using options flow data for years for more consistent profits. It tells them what is happening in the broader market as well as within sectors and individual stocks. This is a critical piece of data in understanding the market. These are measurable forces at work.
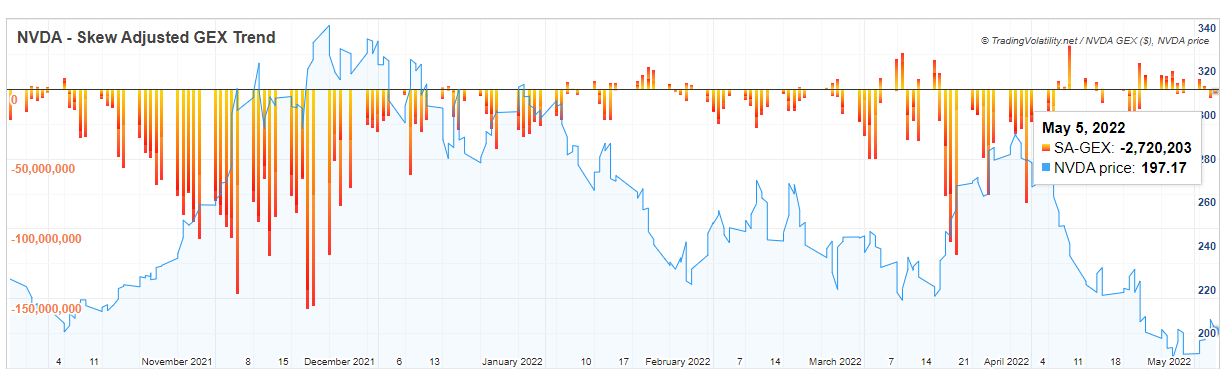
After the high-growth, low income tech names underwent large corrections, other large cap tech is typically the next group of stocks that get sold during a bear cycle. Take this example from $NVDA from last year, highlighting the negative gamma exposure driving price higher.

$NVDA 2021
After peaking in Nov, the Skew-Adjusted GEX trend has been choppy, with the exception of a short counter-trend stock rally in March (below).
It Doesn't Have To Be A Crash
Seasoned investors know that stocks go up and stocks go down, and that those movements are largely driven by the macro picture.
Stocks are currently in a healthy pullback due to the macro backdrop and the options flow data supports that assessment.
When Does The Trend Change?
Retail investors now have the ability to monitor these structural changes along with the pros, thanks to our gamma exposure charts and dashboard. No one knows when the current bear market will and the best we can do is look at the data for significant trend changes.
This is a revolutionary opportunity for any investor / trader who is willing to learn something new. We hope you are up for the challenge and will benefit along with us!