Volatility & Gamma Report - Issue #4
Examining a Gamma Squeeze and Call Ladder
[Note: This post is being added on Substack after originally being posted on Revue (which has discontinued their hosting operations).]
One of the easiest ways to use Gamma Exposure in trading is to look for Call Ladders that help set up a Gamma Squeeze to generate higher prices.
What is a Call Ladder?
“Call Ladder” is how we describe a specific formation created by the distribution of gamma for a given stock.
It is characterized by heavy call gamma located across adjacent strikes that are higher than the current trading price and a decisive lack of put gamma.
The example below is pulled From a previous twitter thread.
$SPRT July 27
$SPRT originally hit the GEX Dashboard scanner in July 2021 with a highly negative SA-GEX to Volume ratio and “Call Ladder” flagged in the Gamma Formation field.
One a stock is flagged as a “Call Ladder” it is a must to look at the gamma formation because it provides clues on its ability to maintain upward pressure. To note:
⭐At least 4 adjacent strong call gamma strikes above current trading price.
⭐SA-GEX to volume less than -0.5.
⭐Make sure Gamma Exposure isn’t expiring soon
What happens during a Gamma Squeeze?
Investors here have purchased a bunch of out-of-the-money call options so Market Makers buy shares to neutralize their exposure from selling of the calls (Market Maker Gamma Exposure is Negative here).
The SA-GEX to Volume ratio provides information about how significant the gamma exposure is in relation to the average daily trade volume.
When the trade volume from MM hedging activity becomes a significant component of trades during the day, there is a scramble by MMs to buy shares as the stock price rises to stay neutral. This puts additional upward pressure on the movement of the stock price.
Compounding the Gamma Squeeze
A gamma squeeze is frequently compounded by the action of a short squeeze. When a stock has a significant amount of Short Interest and price moves rapidly higher above key resistance levels, investors who are short the stock suddenly must also scramble to find shares to buy to cover their position before their position moves further against them.
At this point there are three groups of people scrambling for shares and each are somewhat insensitive to price.
1) MMs who are short calls must buy shares to stay neutral
2) Short sellers must buy to close positions to avoid losses (alternatively, some may buy calls or make other options plays to help offset losses.)
3) Speculators are buying in hopes of cashing in on a parabolic move higher.
Playing Out the Squeeze
Moving forward a few weeks on the $SPRT example we can see how the structure had changed with one day before August options expire.
$SPRT Aug 19
➡️ Stock is up about 25% since late July.
➡️ Gamma has increased 200%-300%, specially around the $8, $9, and $10 strikes.
➡️ About 2/3 of the gamma expires the following day.
➡️ The classification of “Call Ladder” no longer applied since there are only 2 strikes with strong call gamma above the current trade price.
(Note: There was a significant amount of Short Interest, with roughly 40% of the shares sold short.)
The next update from Aug 23 shows that gamma structure after options expiration. The call gamma at the $9, $10, and $11 levels got rolled forward to next month at higher strikes with interest from $12 to $18 coming into focus.
There was strong negative gamma here but the speculators and those with short positions were already fighting over shares as price in the stock had nearly doubled in less a month.
$SPRT Aug 23
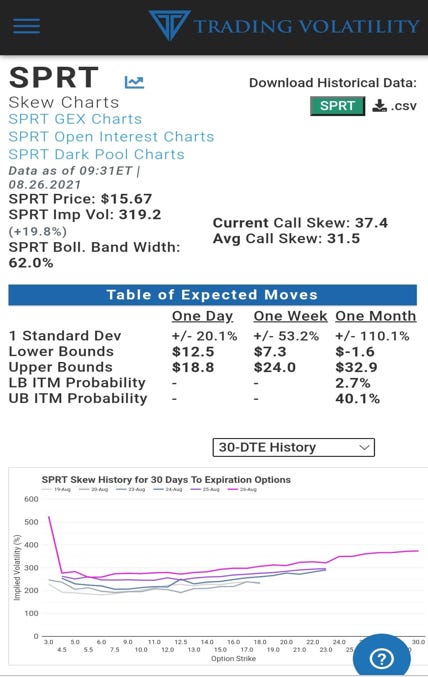
By August 26 the Call Ladder had given way to an range in call strikes up to $23. Also on that day strikes up to $30 were added. The gamma structure also had changed due to increased put gamma as traders attempt to find ways to profit off of extremely high implied volatility on the options (1 month volatility over 300%).
The gamma structure had shifted from a Call Ladder that helps push price higher, to something that just has large negative gamma. The effect is that price moves get exacerbated in both directions.
$SPRT Aug 26
Looking at the implied volatility curve over the previous 5 days you can see IV rise from 200% to well above 300% in some cases. This makes for a 1-week expected range of the stock price to be +/-54%.
Implied volatility of $SPRT Aug 26
$SPRT chart Aug 25
While the implied volatility seemed high at 300%, $SPRT made enormous moves in the subsequent day.
After closing at $19.7 on Aug 26, it ran as high as $59.69 (+203%) on the following day before closing at $26.33.
This was no longer a gamma squeeze. It was a frenzied combination of MMs who were trying to hedge their books, short sellers trying to avoid enormous losses, and speculators in all directions finding themselves off-sides on the trade.
The presence of a Call Ladder is a good way to identify possible imminent action in a stock, but it is not something that by itself will necessarily generate higher prices. If you have any questions on this feel free to email us or tweet us!


