In the ever-evolving world of investing, staying ahead of the game is crucial for consistent profits. Professionals have relied on options flow data for valuable insights into market trends, sector performance, and individual stock movements. An important component of this data is gamma exposure, which provides a unique perspective on market dynamics.
Now retail investors can also tap into the power of gamma exposure to make informed decisions. In this post, we touch on the advantages of utilizing gamma exposure and how investors may use these innovative tools which offer this valuable data.
Options Flow Data: The Secret Weapon of Pros
Options flow data has been a well-guarded secret of professional investors and market makers, granting them a competitive edge in the market. By analyzing this data, they gain valuable insights into market sentiment, potential shifts in trends, and impending price movements. Understanding the broader market landscape, as well as sector-specific and stock-specific data, becomes possible through options flow analysis.
Leveraging Negative Gamma Exposure
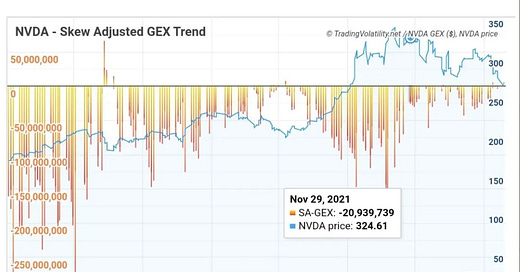
One compelling aspect of options flow analysis is the identification of negative gamma exposure, which often helps drives stock prices higher. Take, for instance, the example of NVIDIA Corporation ($NVDA) from 2021, where negative gamma exposure played a significant role in driving its price higher.
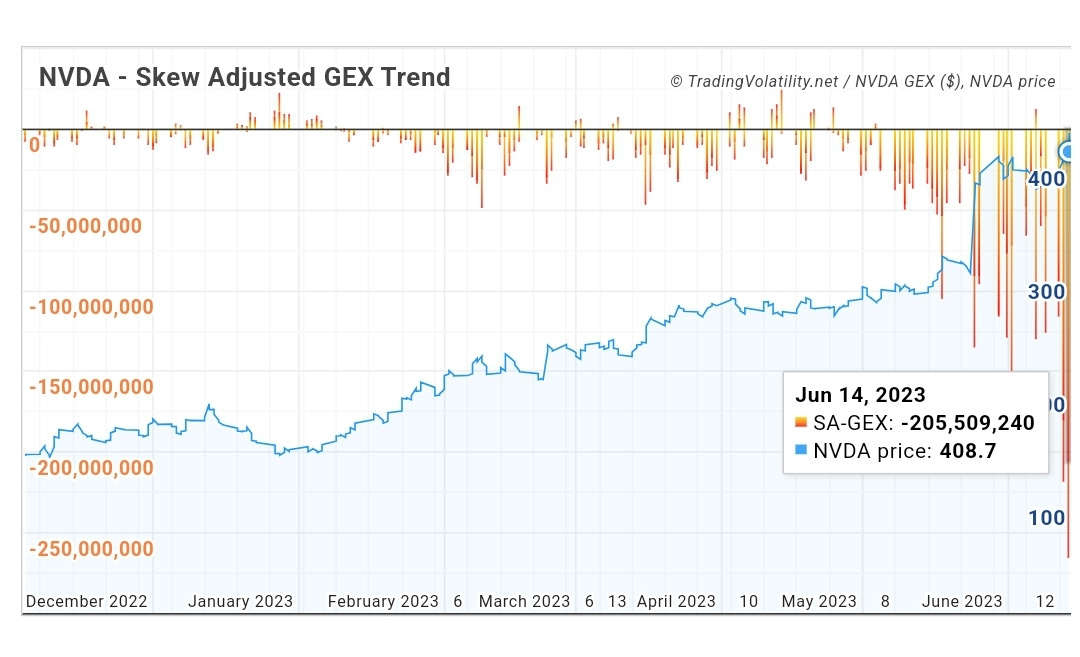
In 2023, NVDA 0.00%↑ is back at it with large negative gamma in a very familiar situation. The 2023 version of the chart:
This pattern can also be observed in other stocks such as Tesla ($TSLA) and Advanced Micro Devices ($AMD), which experienced substantial tailwinds from negative gamma exposure during the first half of 2023.
When Does the Trend Change?
Monitoring these structural changes in the market is possibly by our daily collection of over 1,200 stocks. With our gamma exposure charts and dashboards, retail investors can now stay informed about market trends in a way that is deeper than just looking at charts and moving averages. This accessibility to gamma exposure charts and dashboards empowers investors and traders to make more informed decisions based on quantitative data.
There are two ways for negative gamma in these situations to dissipate
declining price
Fewer speculative calls — either by expiration or by reduced investor interest
Through the use of our dashboards we track expiring gamma at each options expiration date. Users can tailor their personal dashboard to include any stock they wish to track.
Subscribers have the option to receive a daily email summary for the stocks on their watchlist for a short report on all the gamma exposure readings and any significant changes.
Embracing the Opportunity
The availability of gamma exposure data to retail investors is a leap in the world of investing. It provides individuals with a chance to learn something new to improve their trading. By taking advantage of these tools and resources, retail investors can make more informed choices based on data-driven insights. Subscribing to our platform offering comprehensive gamma exposure data and tracking dashboards can be a game-changer for those seeking to enhance their investment strategies.
Conclusion
Investing is largely won by those who have access to the best information. With the introduction of gamma exposure charts and dashboards, retail investors now have the ability to monitor structural shifts and analyze gamma exposure to make more informed investment choices. Embracing this revolutionary opportunity to harness the power of gamma exposure can lead to enhanced profitability and greater success in the world of investing. So why not take up the challenge and subscribe to platforms that offer gamma exposure data and tracking tools? The key to unlocking your potential lies within your reach.
To explore our subscription options, please visit our Subscribe page. We think you’ll find our offerings incredibly helpful. For an evaluation of all the gamma, skew, and dark pool tools we offer you can also purchase a day pass for a nominal fee.


