
Reading the Options Tape: Behavior vs Positioning
Why flow matters more than gamma when interpreting price action

Price doesn’t respond to options positioning. It responds to options behavior.
Two markets can have identical gamma profiles and trade very differently.
The difference is flow.
This post will explain how Options Flow Data can be used to help determine forward price ranges, using example data from $SPX and SMH 0.00%↑ today.
Not all options activity actually moves markets. This is the gap we’re addressing with our newest feature.
Positioning Isn’t the Same as Behavior
Most options tools focus on what are called “positioning metrics”:
Open interest
Gamma exposure (GEX)
Implied volatility and skew
These metrics are essential — and we rely on them heavily.
But positioning describes potential energy.
Flow describes active behavior.
But positioning describes potential energy.
Flow describes active behavior.
Price responds to behavior.
Introducing Options Flow Diagnostics
Our Options Flow Diagnostics summarize what those prints imply about market behavior — whether today’s activity is likely to reinforce, dampen, or ignore price movement.
We measure:
speculative vs structured activity
fresh flow vs existing positioning
aggressiveness of upside targeting
dominance of short-dated expirations
call vs put pressure
Rather than isolated metrics, we synthesize these into flow regimes:
Hedging / Overwrite
Mixed
Speculative Call Demand
These regimes help explain how price is likely to behave, not just where exposure sits.
Case Study Breakdown: SPX Options Flow
Question: What does today’s flow allow and limit over the next 1–3 sessions?
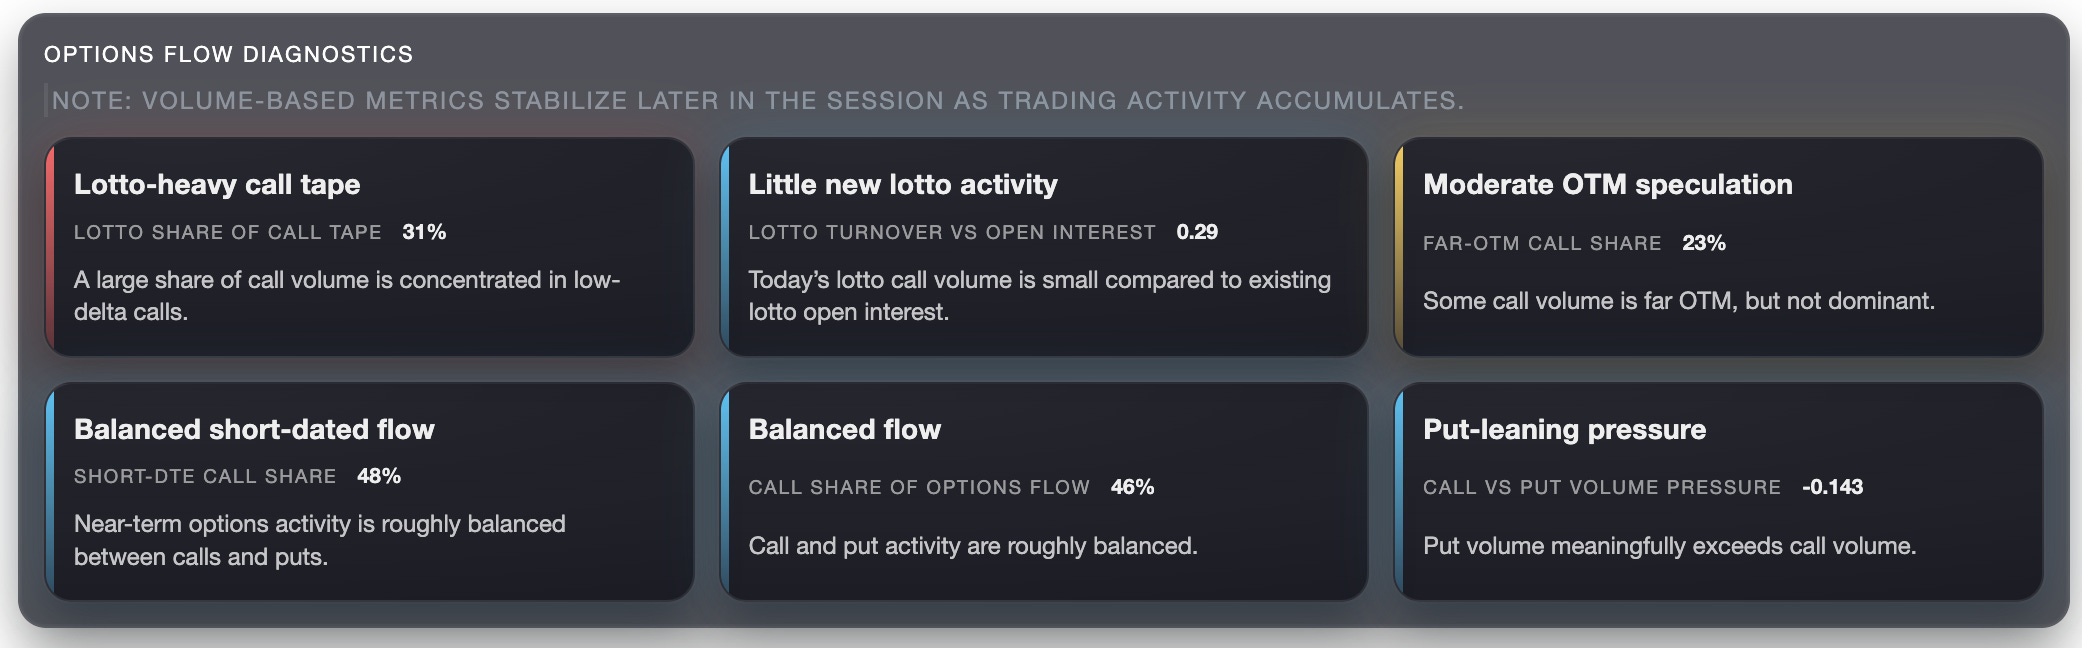
Summary of today’s SPX tape:
Lotto participation: elevated but not extreme
Fresh speculative demand: lacking
Upside targeting: controlled, not convex
Short-dated flow: neutral
Directional bias: absent
Pressure: mildly defensive
What this setup favors:
controlled or rotational price action
pauses after strength
responsiveness to external catalysts
What it limits:
call-driven squeezes
runaway upside
self-reinforcing momentum
This is a market that can move — but likely needs spot participation or new information to do so.
A Second Example: SMH Breaks Out Against the Options Tape
SMH broke above its rising channel.
On the surface, it looked like clean continuation.
The options tape told a different story.
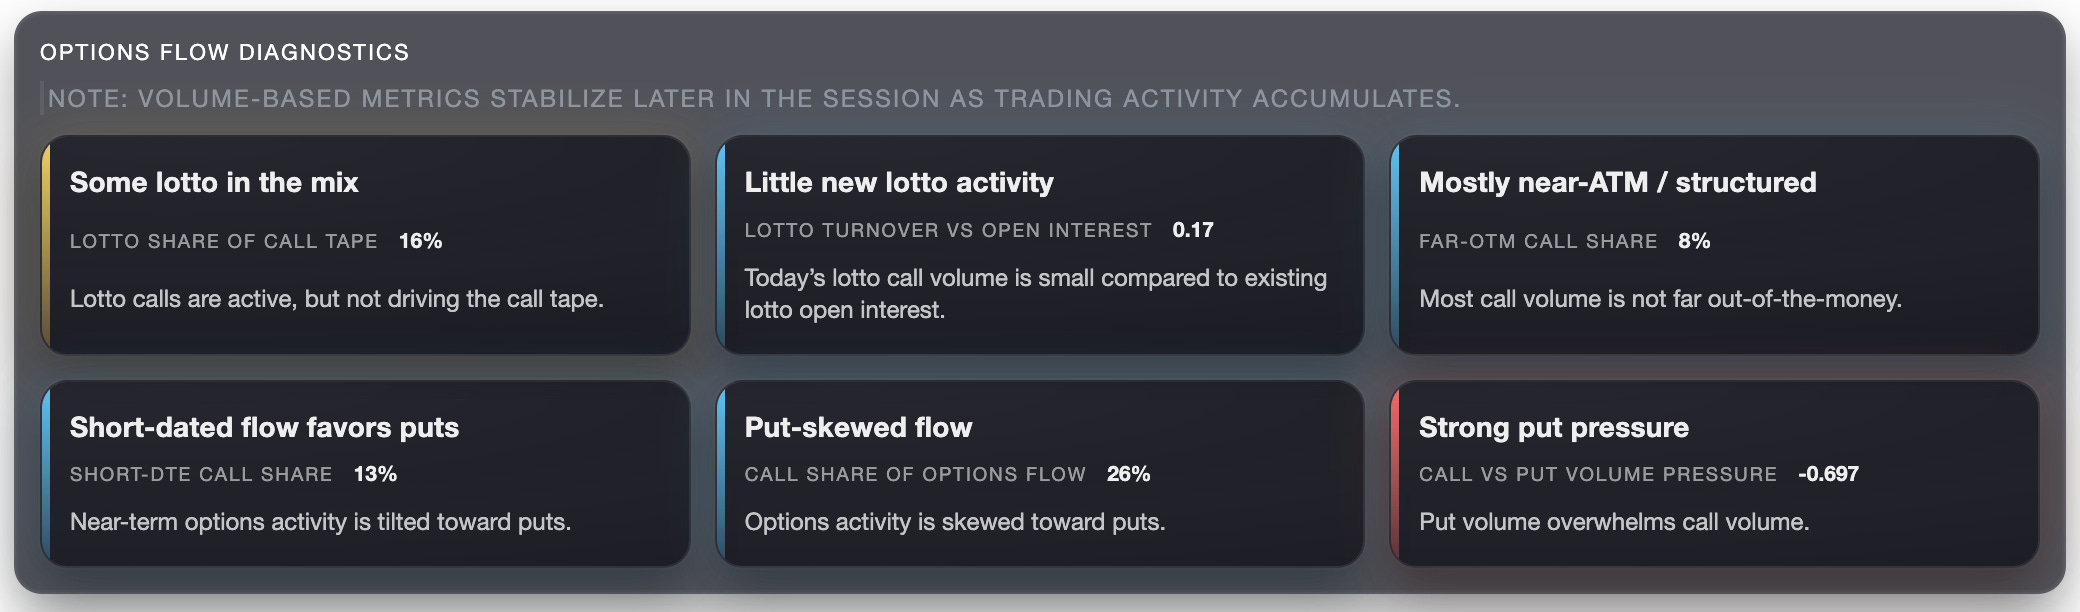
Key observations:
No fresh call conviction
Conservative strike selection
Short-dated flow strongly put-dominated
Defensive pressure elevated
This was not a call-driven breakout.
That doesn’t mean price must fall — but it does mean upside is being tolerated, not chased.
That distinction matters.
How to Use This Practically
Flow diagnostics are not trade signals.
They’re expectation setters.
Use them to:
temper momentum assumptions
favor mean-reversion when flow is defensive
spot regime shifts early via short-dated or turnover metrics
Flow doesn’t tell you what must happen.
It tells you what the market is set up to allow.